Proven Results. Measurable Impact.


7x
Boost in team productivity

83%
Reduction in processing costs

87%
Faster data processing speed
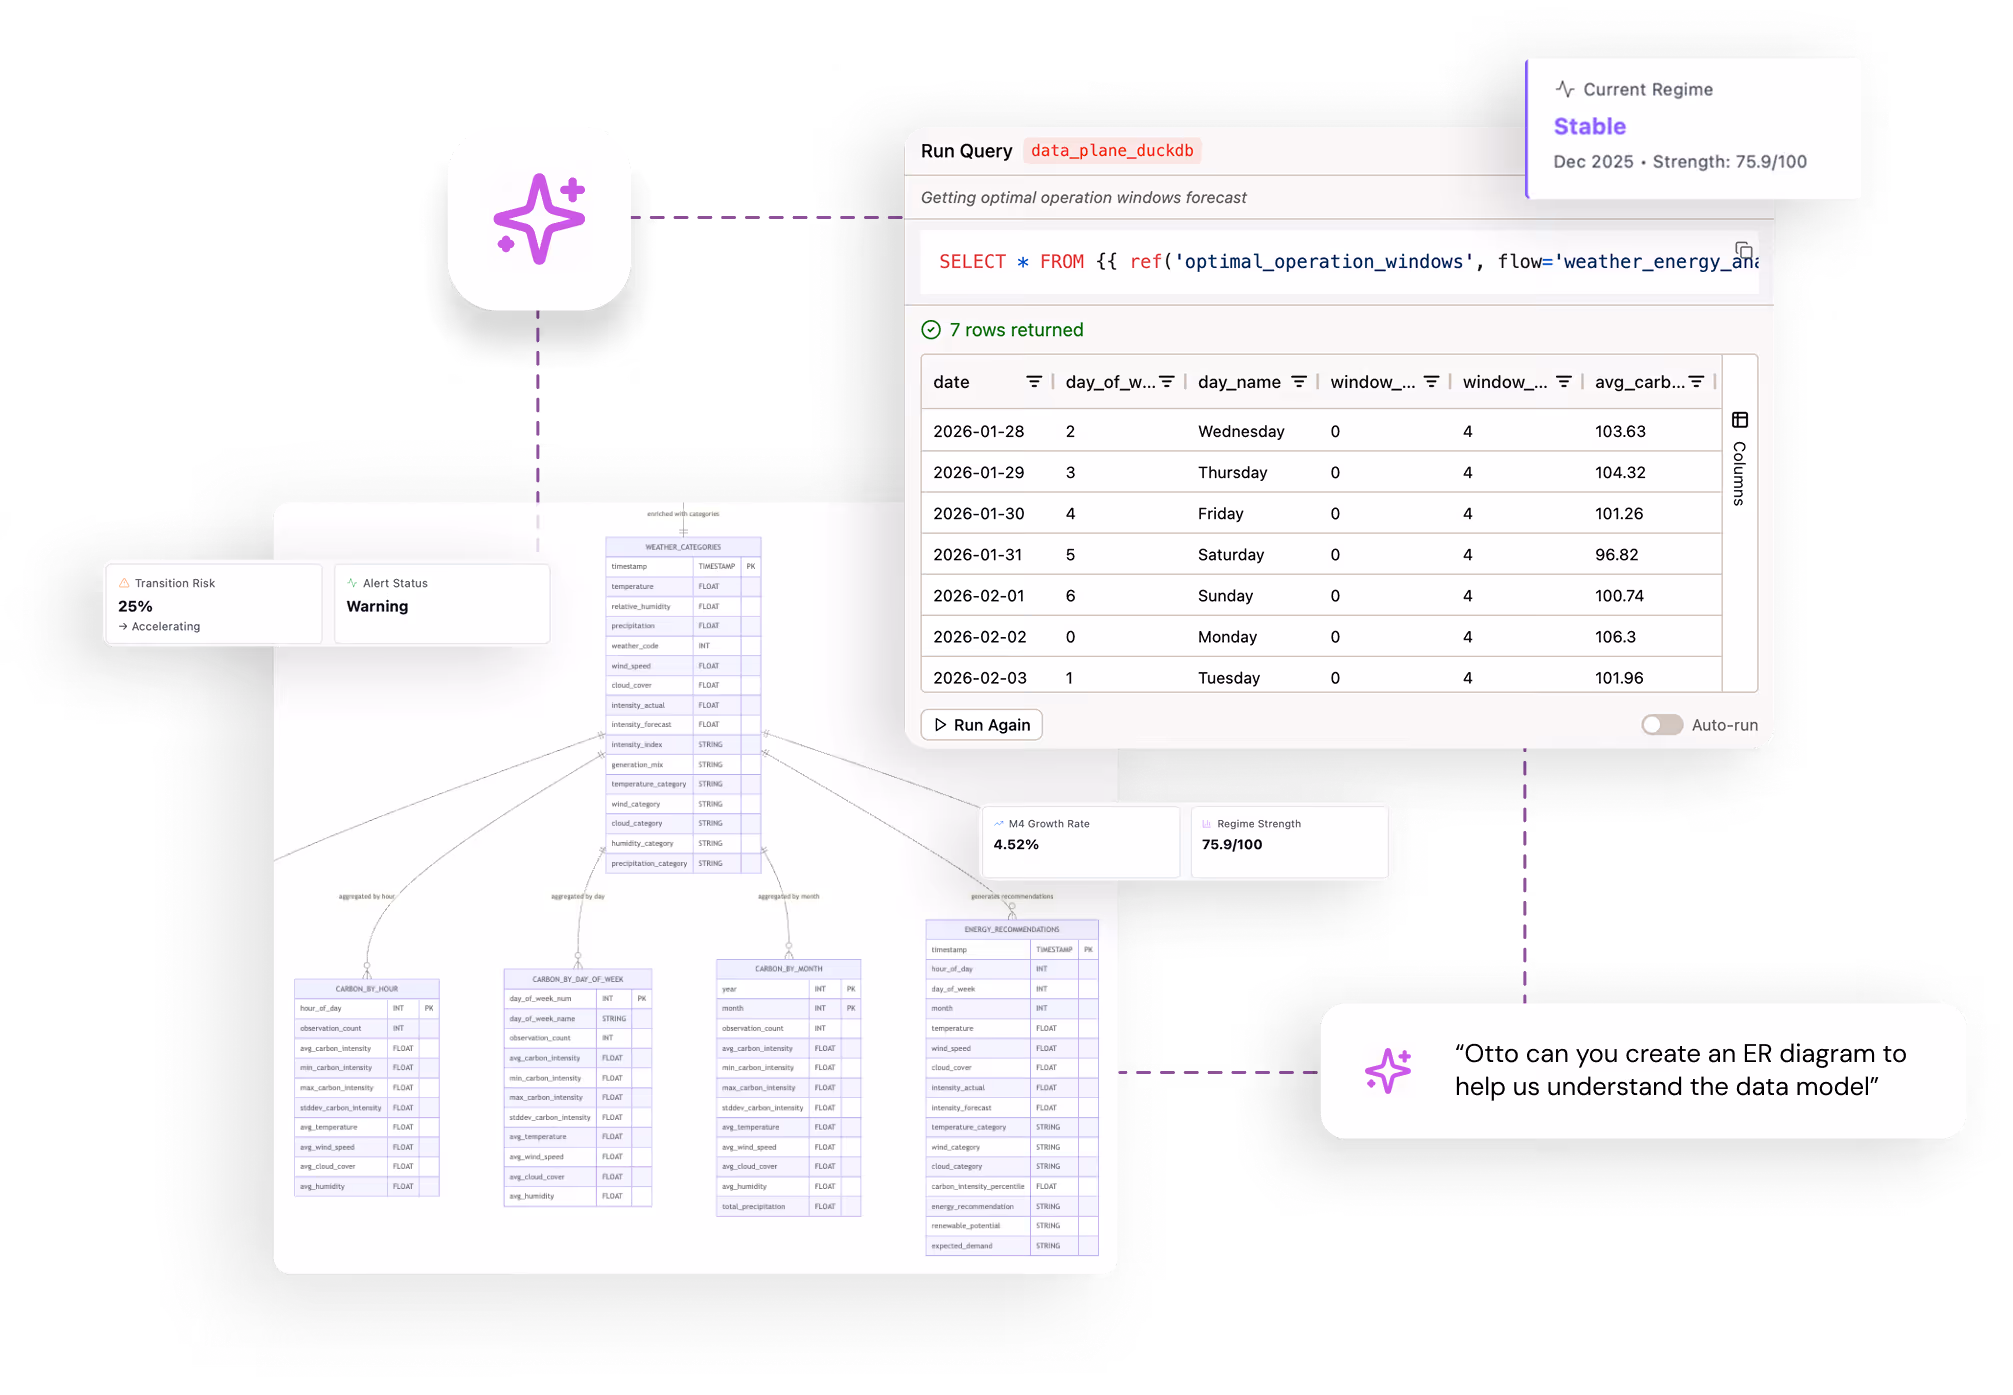
Tell Otto what you need. It builds reports, charts, dashboards, and visual analytics instantly — no code, no bottlenecks.
Query and visualize across Snowflake, Databricks, APIs, and databases without switching tools or contexts.
Otto doesn't just show you data — it spots the anomalies you'd miss, explains what's driving a trend, and tells you what to do next.
Save visualizations to your git repository and share them with stakeholders. Not extra tools, to export headaches.
Test hypotheses and validate outputs on the fly. Write your queries or have agents write the code for you, then see results instantly.
Need a bar chart? A trend analysis? A custom dashboard? Just ask Otto. AI agents generate visualizations instantly — whether you’re an engineer validating pipeline outputs or an analyst exploring new datasets. No SQL required, no context switching, no waiting.
.avif)
Otto automatically spots what matters. It surfaces outliers, flags quality issues, identifies emerging patterns, and explains the “why” behind your data — all in real time, getting you from raw data to real insights, fast.
Everything's versioned, shareable, and already where your team works.
.avif)
Need to check a calculation? Test a join? Debug a transformation? Ascend lets you run ad-hoc SQL queries against any table or connection — then visualize results instantly. Get answers in seconds, not hours.
.avif)
Stop jumping between tools to compare data from different systems. Ascend’s AI agents let you query, visualize, and analyze data from across Snowflake, Databricks, BigQuery, and every other source you've connected.
.avif)

Free Up Analytics and Data Engineering Time